 |
June 5, 2026 |
|
|
June 2026 Results — Week 1
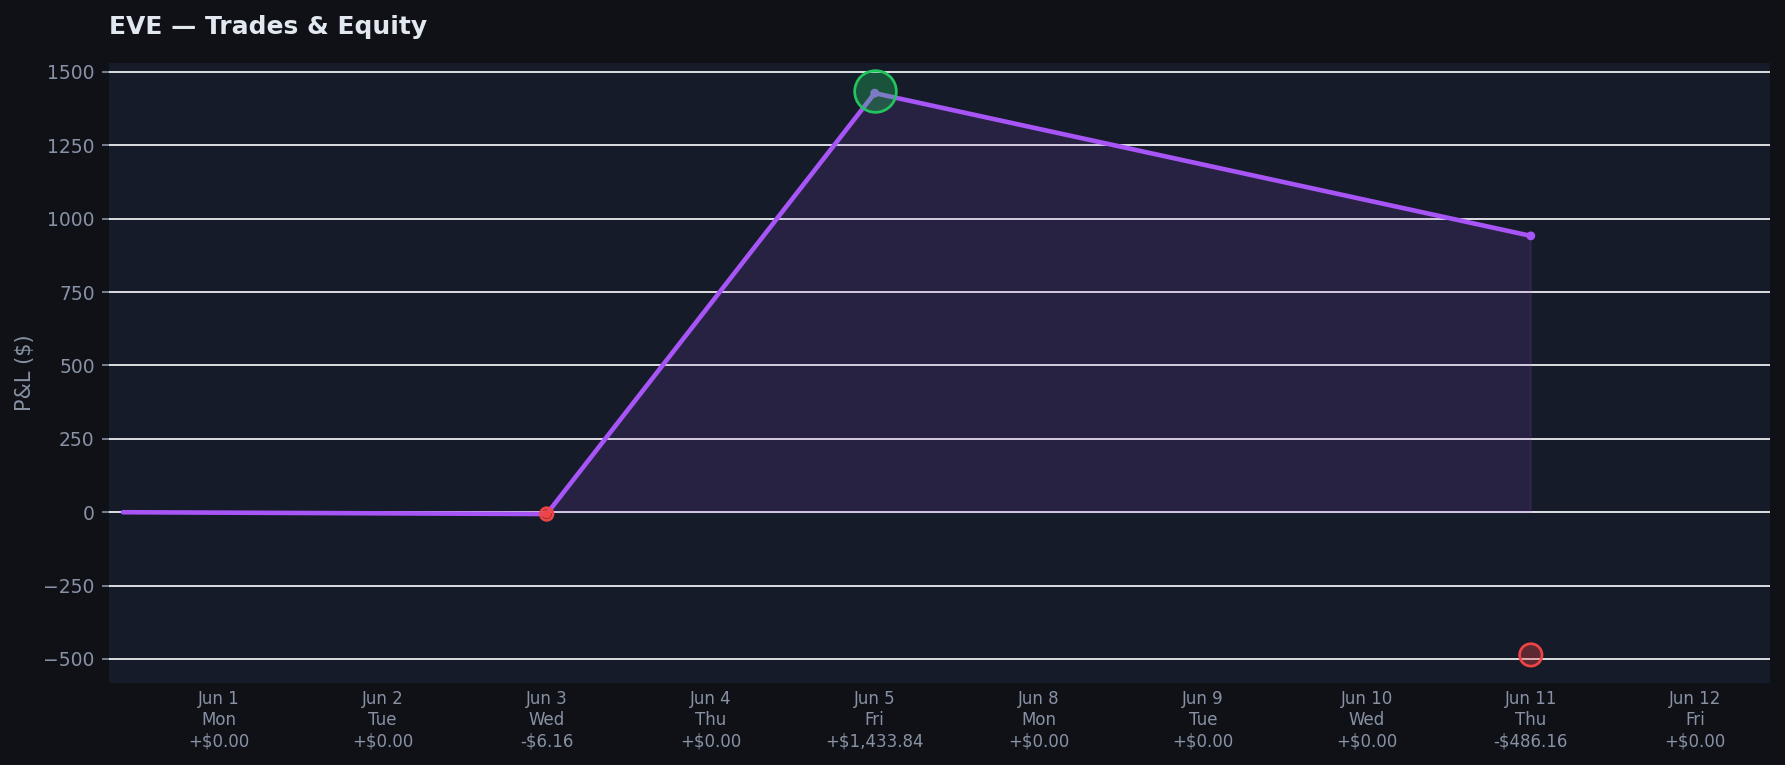
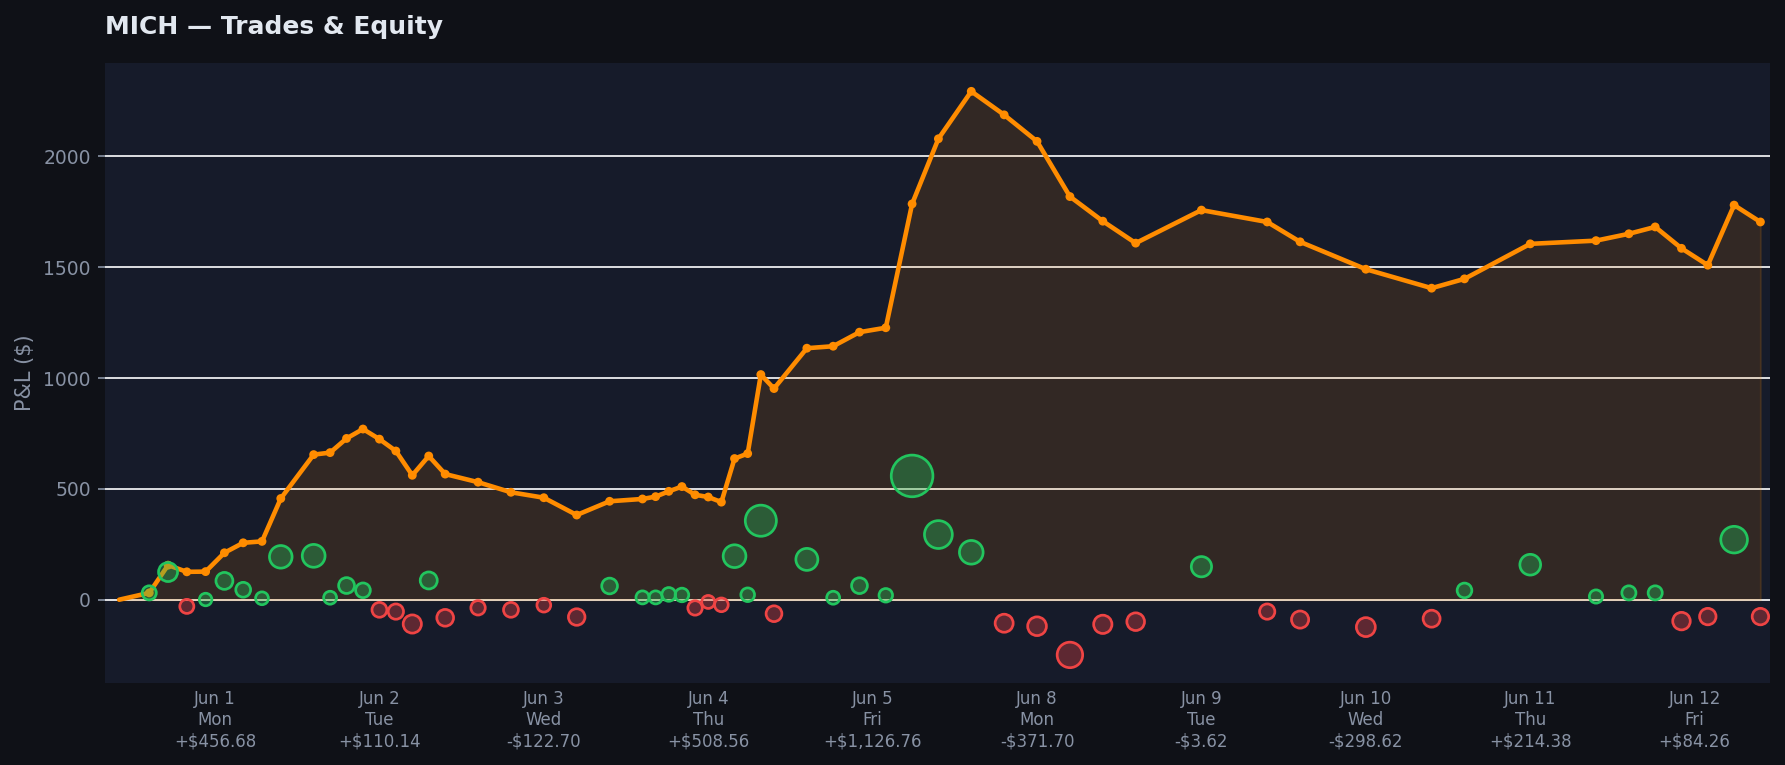
EVE™ +$1,434. MICH™ +$1,127.
Friday Delivers the Best Day of the Month.
These are real trades executed live in the market — not backtests, not simulations.
Every bubble on every chart is an actual order filled on NinjaTrader 8 on MNQ Futures.
Week 1 of June ends on an outstanding note — Friday’s sharp NQ selloff (down ~2% on a stronger-than-expected May payrolls report and surging bond yields) gave our bots ideal directional conditions.
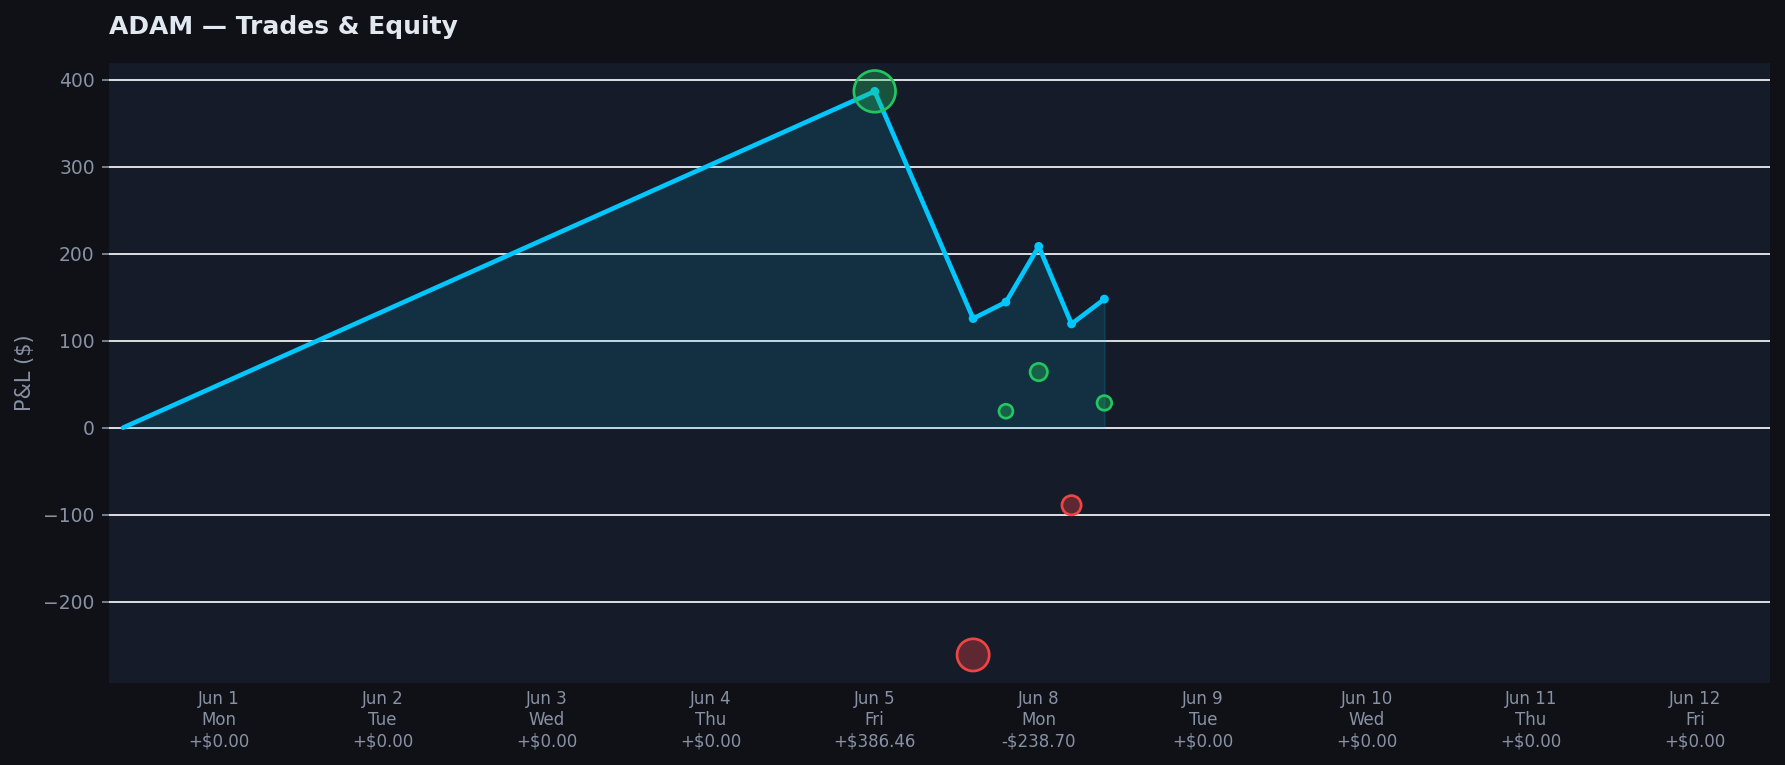
EVE™ booked +$1,434 on a single trade, MICH™ added +$1,127 across 6 trades, and ADAM™ contributed +$386 for its first trade of the month.
The portfolio closes Week 1 at $3,371 MTD across 5 trading days, averaging $674/day across all 8 bots.
DUO2™
$34.78 |
DUOrc™
$78.62 |
ORBO2™
$77.72 |
ORBOib™
$81.88 |
ADAM™
$386.46 |
EVE™
$1,427.68 |
MICH™
$2,079.44 |
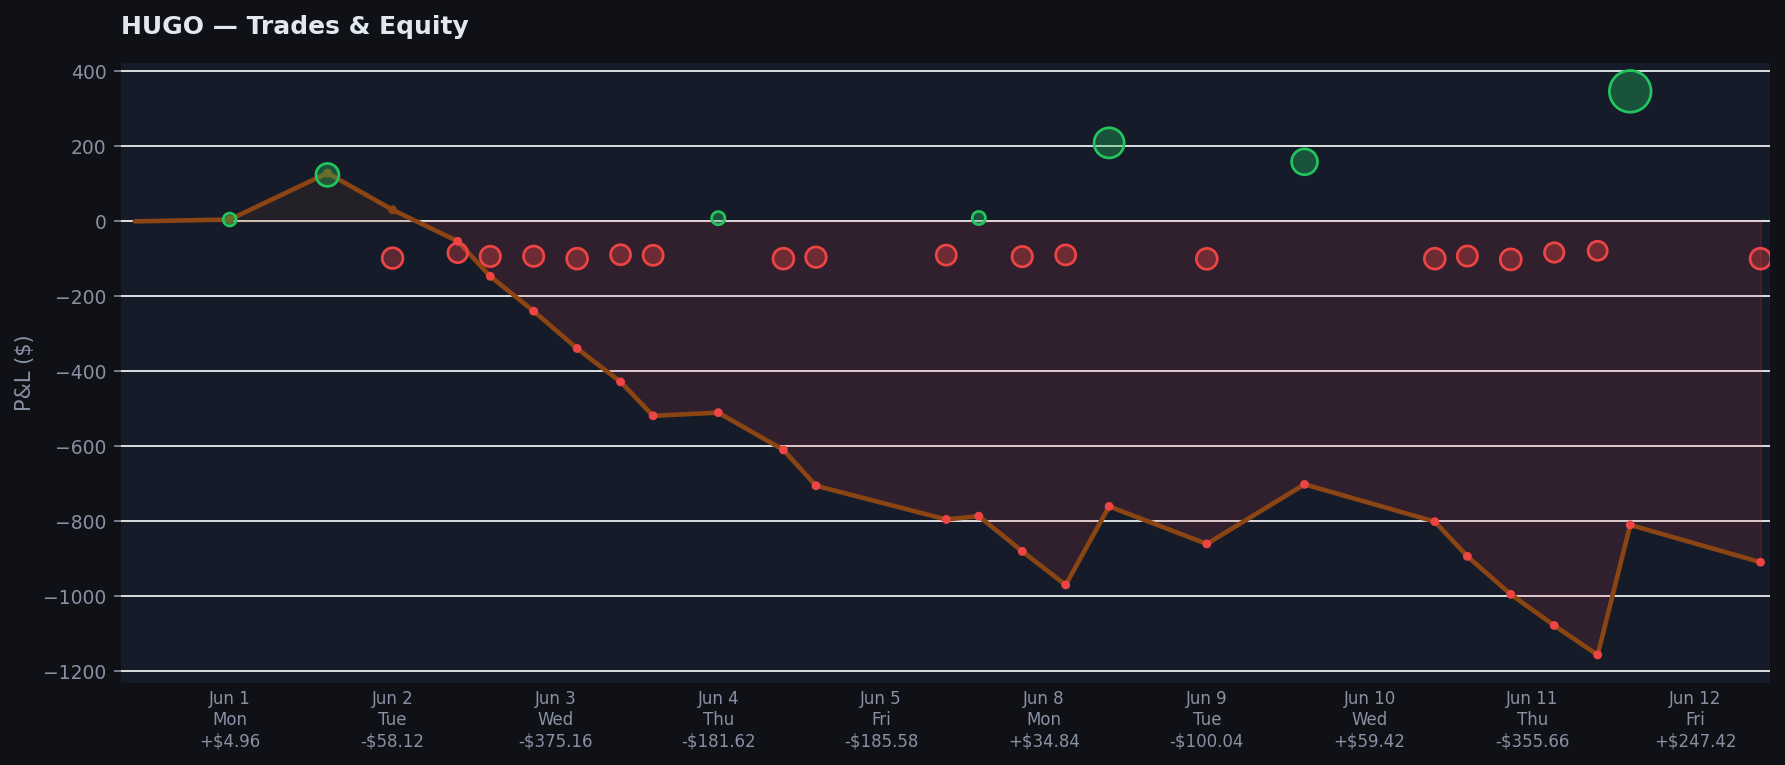
HUGO™
-$795.52 |
|
|
Want to explore the data further? The full performance page has interactive charts where you can hover over every single trade.
View Full Interactive Charts →
|
|
|
Deep Dive
All 8 Bots — Trade Charts & Stats
Each chart shows individual trades as bubbles grouped by day. The line tracks running cumulative equity. June 1–5 data.
|
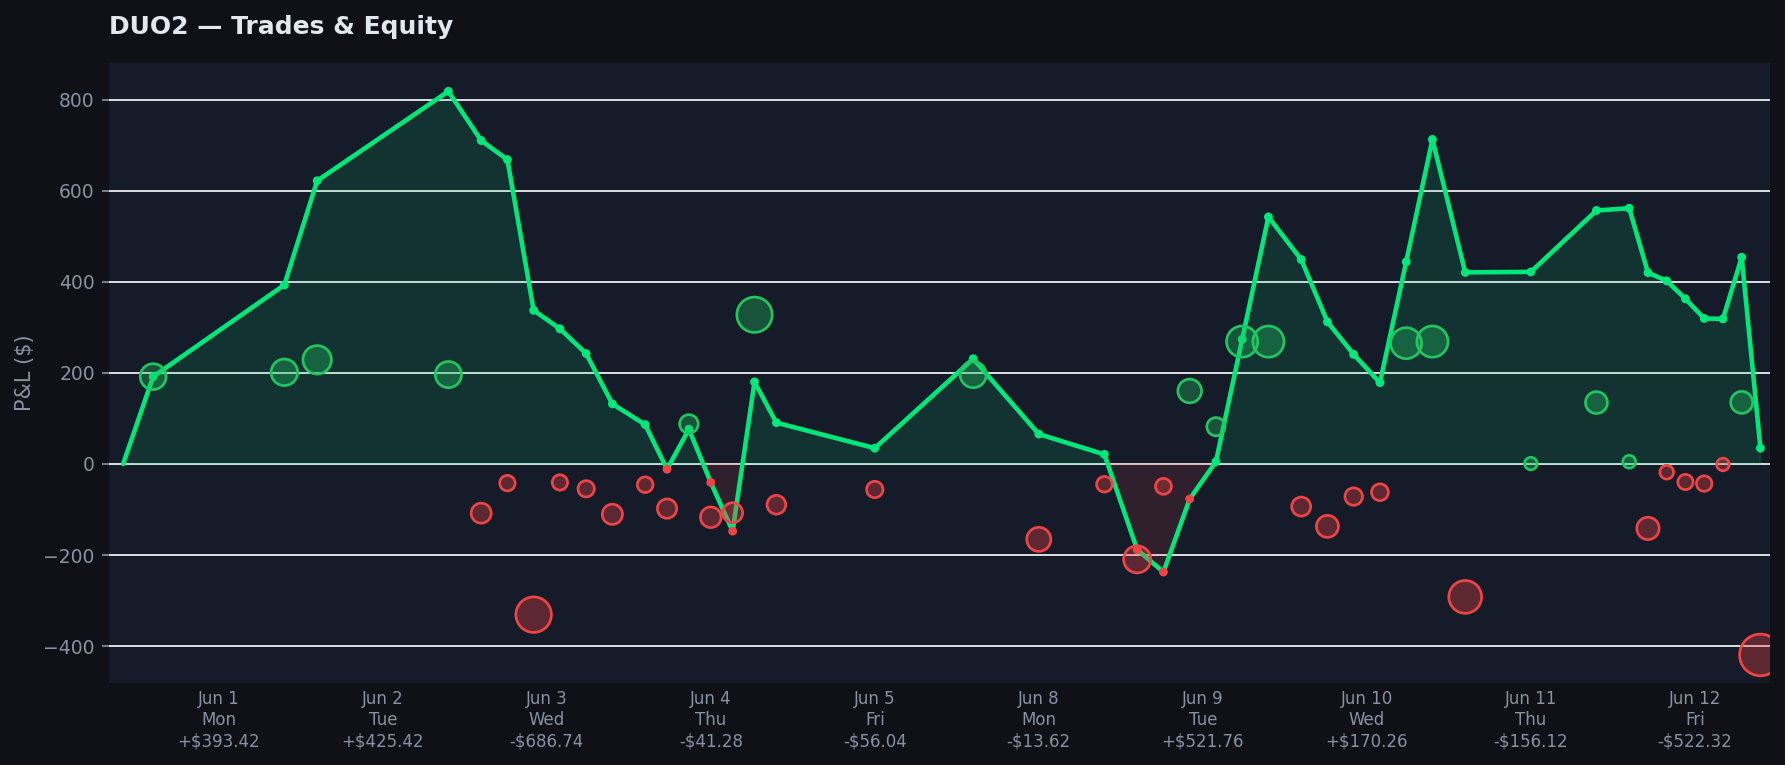
| DUO2™5m • Asia, Europe and America Sessions |
Subscribe$34.78 |
$34.78 Net Profit June MTD |
18 Total Trades 5 active days |
33.3% Win Rate winners / total |
1.03 Profit Factor gross profit / loss |
$6.96 Avg Daily Profit over 5-day weeks |
-$966 Max Drawdown peak-to-trough |
$205.79 Avg Win per winning trade |
-$100.00 Avg Loss 2.06x ratio |
|
|
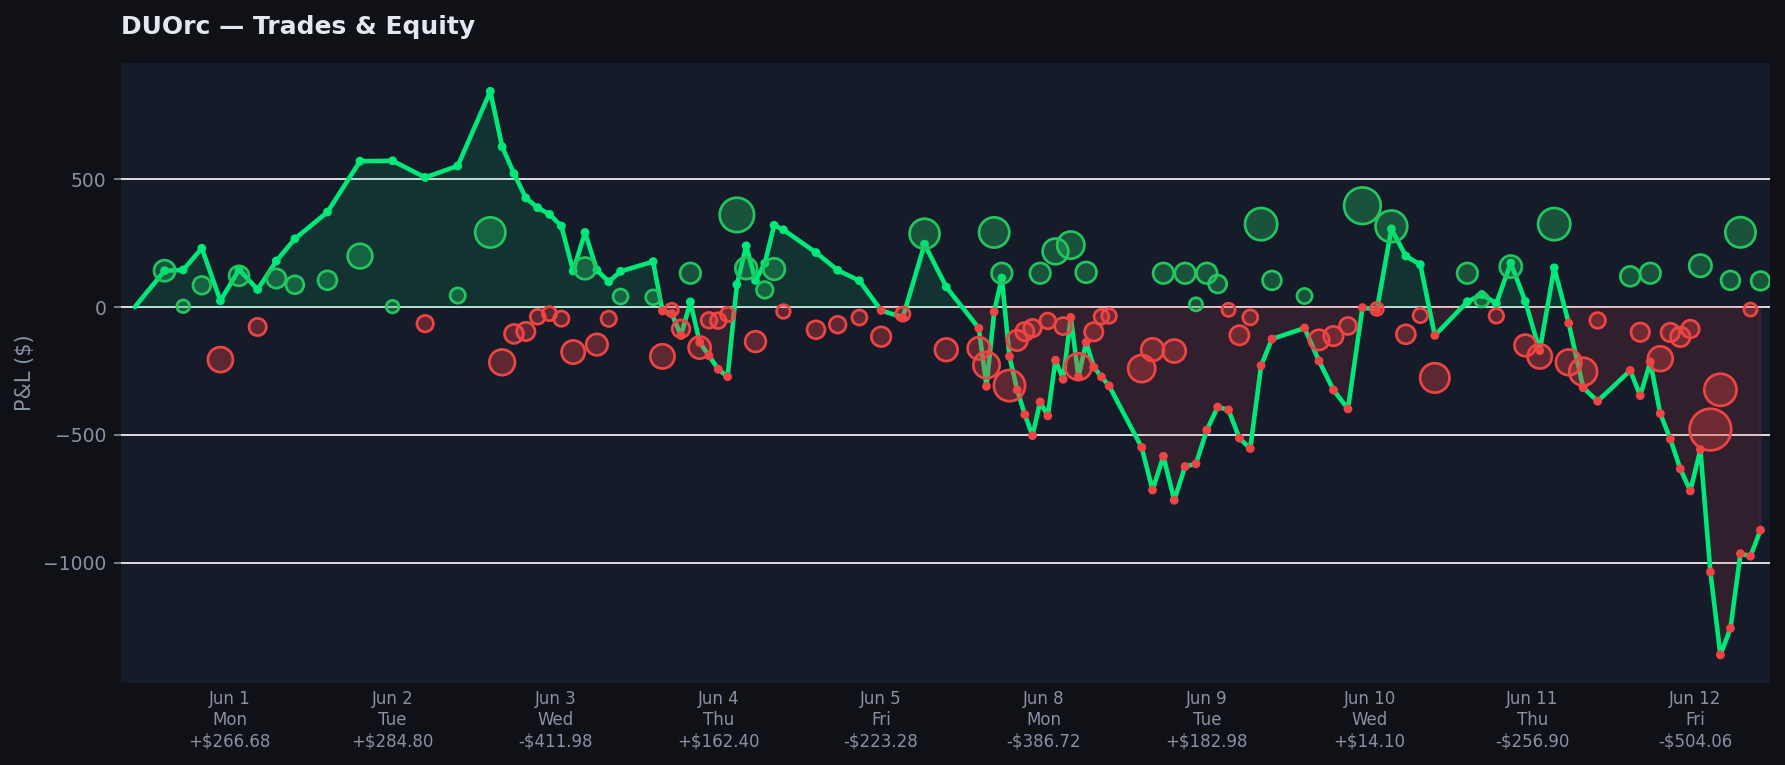
| DUOrc™5m • Reversal Confirmation · Free with DUO2™ |
Subscribe$78.62 |
$78.62 Net Profit June MTD |
47 Total Trades 5 active days |
42.6% Win Rate winners / total |
1.03 Profit Factor gross profit / loss |
$15.72 Avg Daily Profit over 5-day weeks |
-$1,115 Max Drawdown peak-to-trough |
$128.34 Avg Win per winning trade |
-$92.15 Avg Loss 1.39x ratio |
|
|
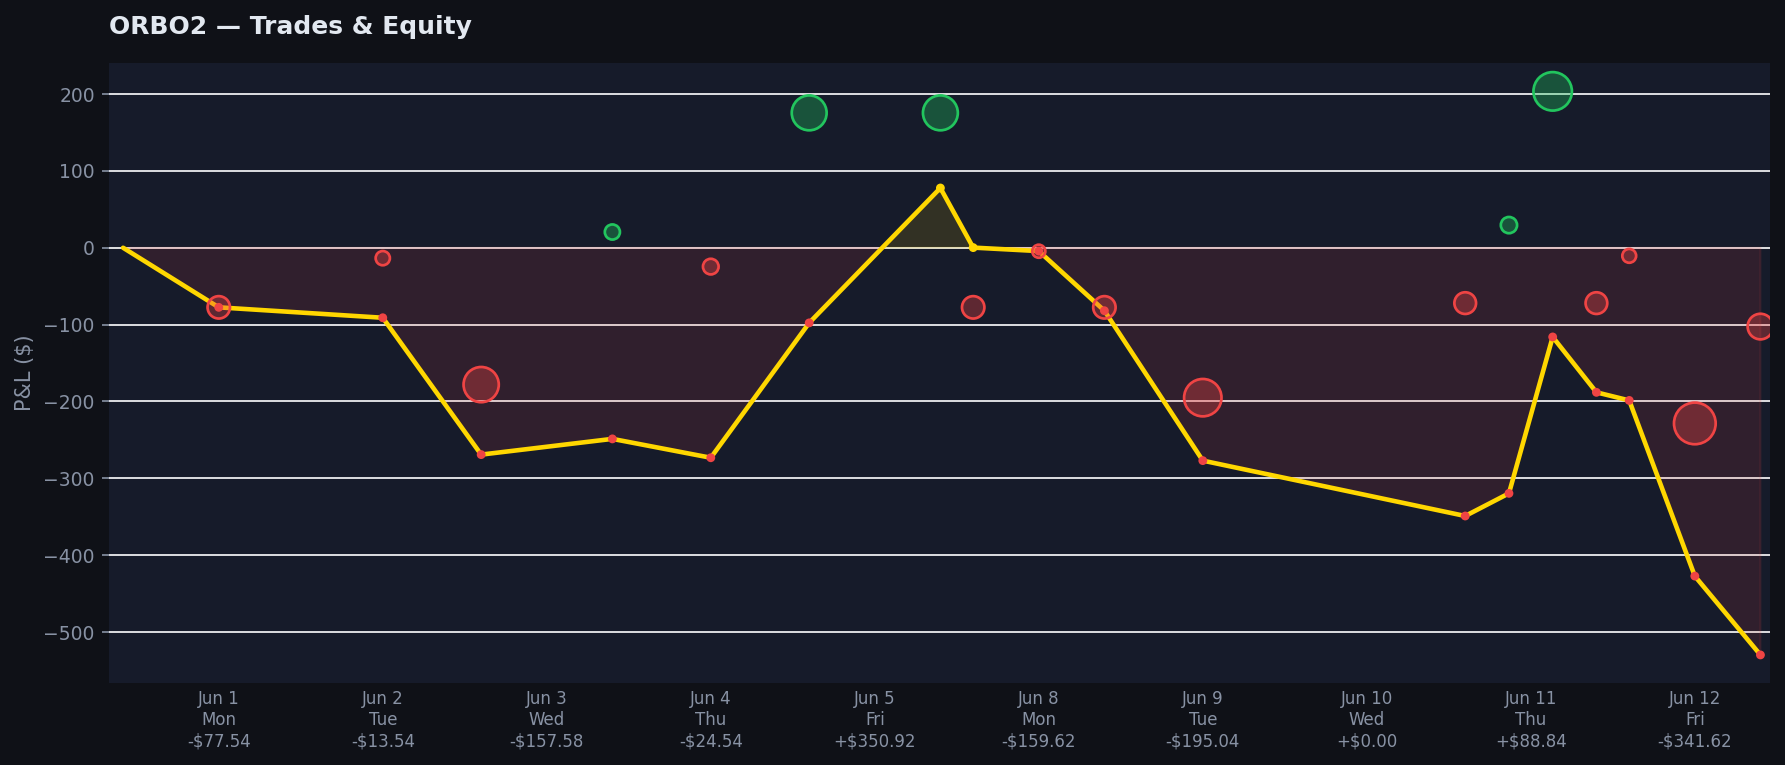
| ORBO2™1m • 15m 9:30-9:45 Opening Range |
Subscribe$77.72 |
$77.72 Net Profit June MTD |
7 Total Trades 5 active days |
42.9% Win Rate winners / total |
1.26 Profit Factor gross profit / loss |
$15.54 Avg Daily Profit over 5-day weeks |
-$273 Max Drawdown peak-to-trough |
$123.79 Avg Win per winning trade |
-$73.42 Avg Loss 1.69x ratio |
|
|
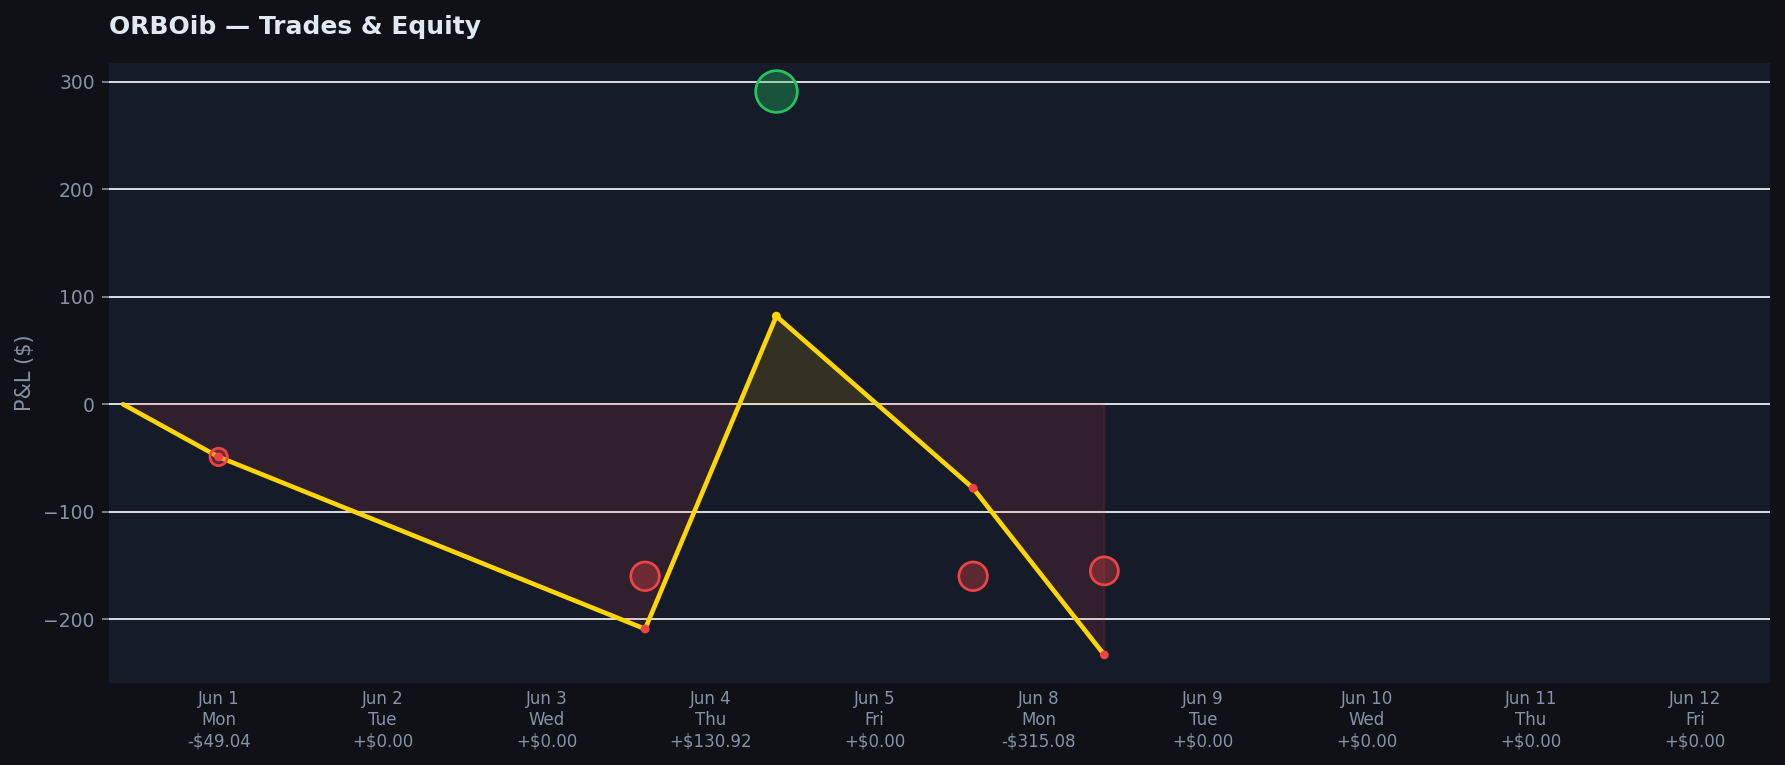
| ORBOib™1m • 1h Initial Balance Opening Range · Free with ORBO2™ |
Subscribe$81.88 |
$81.88 Net Profit June MTD |
3 Total Trades 2 active days |
33.3% Win Rate winners / total |
1.39 Profit Factor gross profit / loss |
$16.38 Avg Daily Profit over 5-day weeks |
-$209 Max Drawdown peak-to-trough |
$290.96 Avg Win per winning trade |
-$104.54 Avg Loss 2.78x ratio |
|
|
$386.46 Net Profit June MTD |
1 Total Trades 1 active day |
100.0% Win Rate winners / total |
∞ Profit Factor gross profit / loss |
$77.29 Avg Daily Profit over 5-day weeks |
$0 Max Drawdown peak-to-trough |
$386.46 Avg Win per winning trade |
— Avg Loss no losses yet |
|
|
| EVE™30s • America Session · 4 Contracts |
Subscribe$1,427.68 |
$1,427.68 Net Profit June MTD |
2 Total Trades 2 active days |
50.0% Win Rate winners / total |
232.77 Profit Factor gross profit / loss |
$285.54 Avg Daily Profit over 5-day weeks |
-$6 Max Drawdown peak-to-trough |
$1,433.84 Avg Win per winning trade |
-$6.16 Avg Loss 232.77x ratio |
|
|
| MICH™5m • Asia, Europe and America Sessions |
Subscribe$2,079.44 |
$2,079.44 Net Profit June MTD |
39 Total Trades 5 active days |
66.7% Win Rate winners / total |
4.26 Profit Factor gross profit / loss |
$415.89 Avg Daily Profit over 5-day weeks |
-$388 Max Drawdown peak-to-trough |
$104.52 Avg Win per winning trade |
-$49.08 Avg Loss 2.13x ratio |
|
|
| HUGO™15m • Asia, Europe and America Sessions |
Subscribe-$795.52 |
-$795.52 Net Profit June MTD |
13 Total Trades 5 active days |
23.1% Win Rate winners / total |
0.15 Profit Factor gross profit / loss |
-$159.10 Avg Daily Profit over 5-day weeks |
-$924 Max Drawdown peak-to-trough |
$45.79 Avg Win per winning trade |
-$93.29 Avg Loss 0.49x ratio |
|
|
|
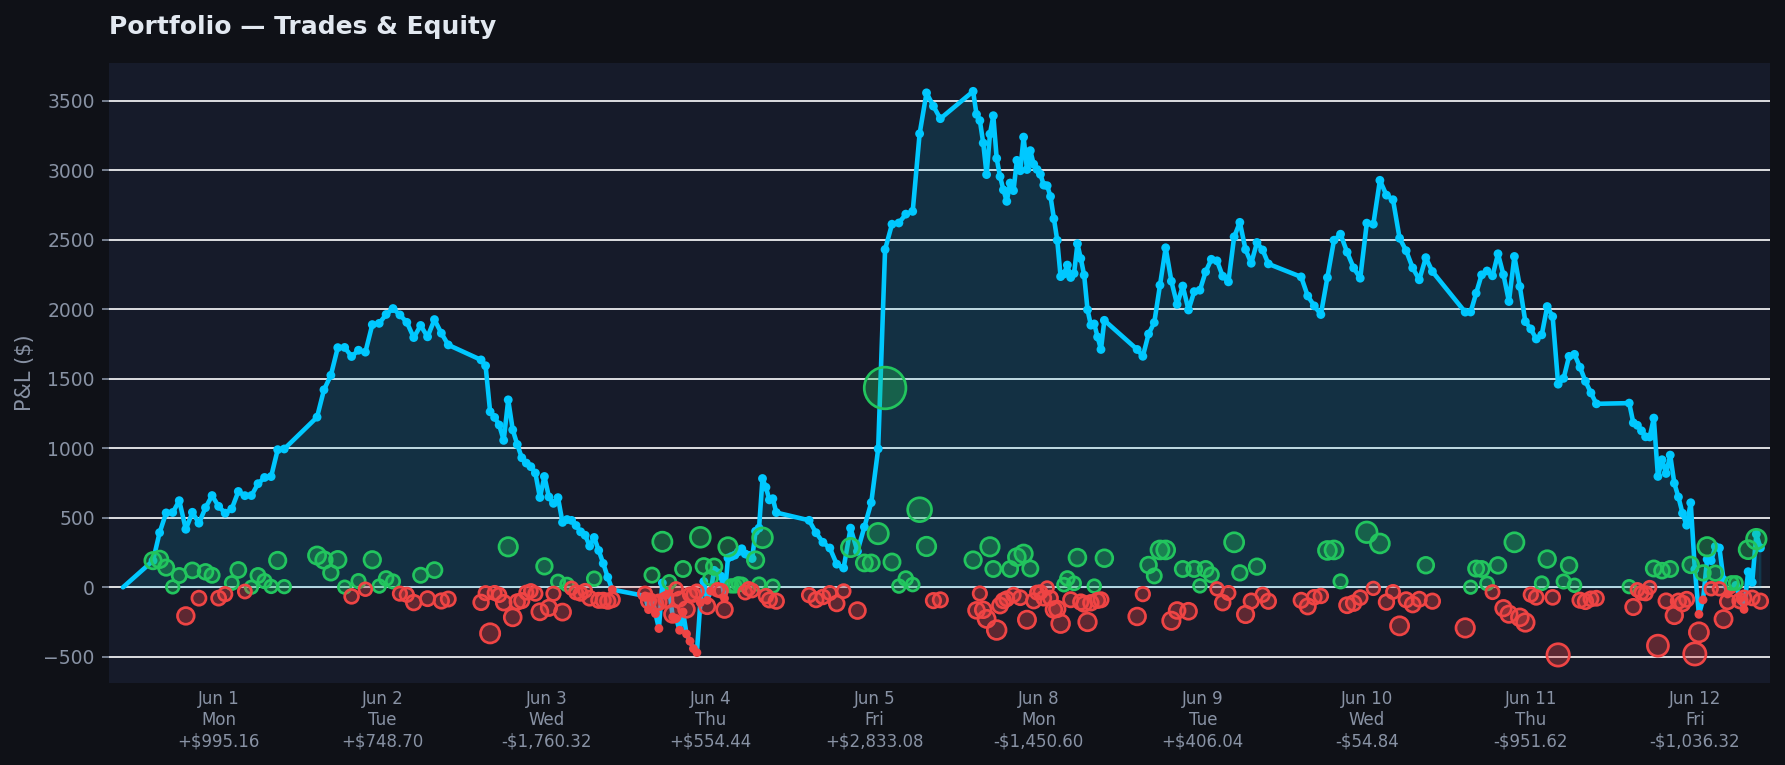
Portfolio View
All 8 Bots — Combined
$3,371.06 Combined Net June MTD Week 1 |
130 Total Trades 5 trading days |
46.9% Win Rate 61W / 69L |
-$2,475 Max Drawdown peak-to-trough |
$674.21 Avg Daily over 5-day weeks |
1.58 Profit Factor gross profit / loss |
+$149.82 / -$83.59 Avg Win / Loss per trade |
1.79× Win/Loss Ratio avg win vs avg loss |
| Date |
Trades |
Daily P&L |
Running Total |
| Jun 1 Mon | 21 | +$995.16 | +$995.16 |
| Jun 2 Tue | 20 | +$748.70 | +$1,743.86 |
| Jun 3 Wed | 30 | -$1,760.32 | -$16.46 |
| Jun 4 Thu | 39 | +$554.44 | +$537.98 |
| Jun 5 Fri | 20 | +$2,833.08 | +$3,371.06 |
| TOTAL — June 2026 Week 1 | $3,371.06 |
|
|
Featured
DUO2™ — The Algo That Never Sleeps
Our flagship strategy running around the clock across Asia, Europe and American sessions. Watch it in action.
|
|
Join Our Free Discord
|
|
You’re receiving this because you subscribed to our trading alerts.
Past performance is not indicative of future results. Trading involves significant risk of loss.
© 2026 AutoEdge Systems™. All rights reserved.
|